KPI Tracking
Feature
Designing a solution for measuring and visualizing KPIs directly in journey maps, balancing simplicity for beginners and flexibility for advanced users.
Problem Statement
Users want to clearly tie measurable outcomes: KPIs, NPS, and satisfaction scores to a journey map or even to specific stages within it. This presented a twofold challenge:
Beginner users needed a quick, simple way to input KPIs without feeling overwhelmed.
Advanced users needed flexibility and the ability to track multiple metrics, visualize progress, and configure details.
The core design challenge
The challenge was to create an experience that felt simple and approachable without sacrificing flexibility. By streamlining the creation flow and reducing the number of required inputs, I lowered the barrier to entry for new users while maintaining the functionality expected by advanced users.
Discovery Process
We used the Continuous Discovery approach developed by Teresa Torres - running regular, lightweight interviews with active users to inform ongoing product decisions rather than a single large research phase.
Why Continuous Discovery?
Teresa Torres' framework keeps product teams connected to real user needs on an ongoing basis. Small, regular touchpoints with users meant we could test assumptions quickly and adjust direction before investing heavily in design.
This was especially valuable for a feature with two distinct user types — we needed to deeply understand both groups' mental models before designing anything.
Rather than running one big discovery project, continuous discovery means having regular touchpoints with customers to inform ongoing product decisions.
What we learned from users
Build a KPI feature flexible enough for advanced users who need multiple metrics and chart types, while remaining simple enough that a beginner can add their first KPI in seconds — without the two experiences getting in each other's way.
How theyDo and Smaply approached the problem
We analyzed how the two main competitors — theyDo and Smaply — approached similar features within their journey mapping tools. The goal was to understand the solution space and identify gaps we could address.
Key takeaways from the analysis
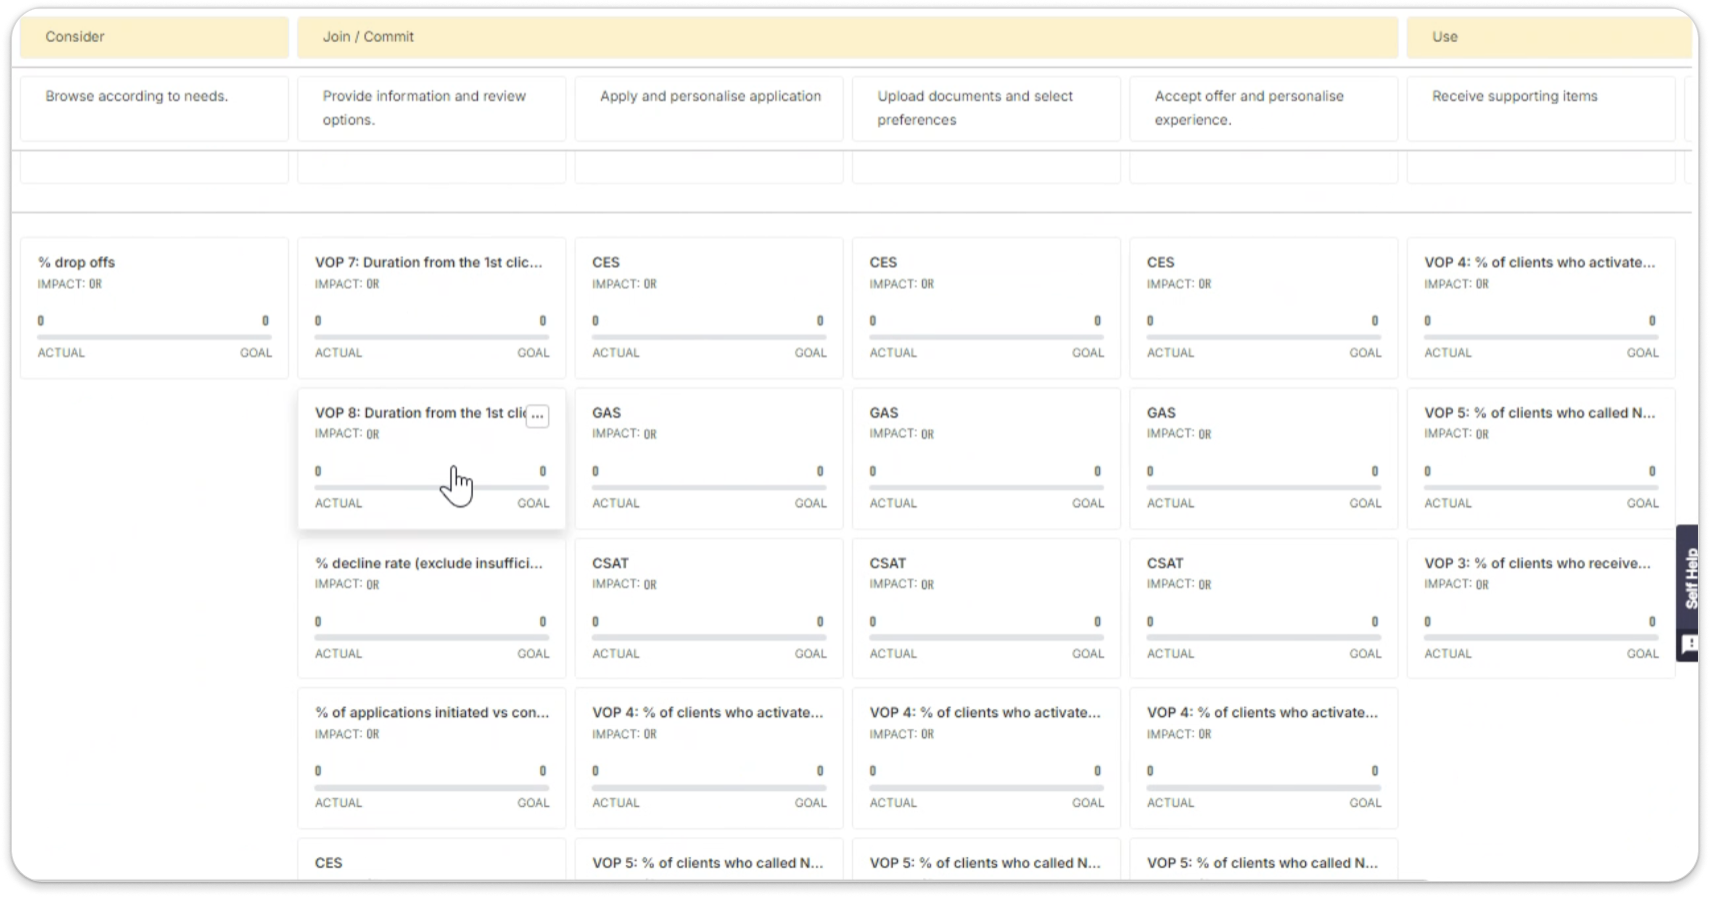
theyDo had the most mature approach — metrics embedded directly in journey stages. But the input experience was rigid and required data to be structured in a specific format.
Smaply offered simpler metric attachment but very limited visualization options. Users couldn't see trends or compare values across stages.
Neither tool solved both flexibility and simplicity at once. That gap defined our design direction.
Key improvements shipped
The final design delivered three major capabilities: the ability to track different types of data, multiple visualization options, and a library of reusable metrics — all within one cohesive system that works for both beginners and advanced users.
The metric form — designed for both user types
The final design included a simplified option to search and add metrics at the map or stage level, keeping the entry point frictionless for beginners.
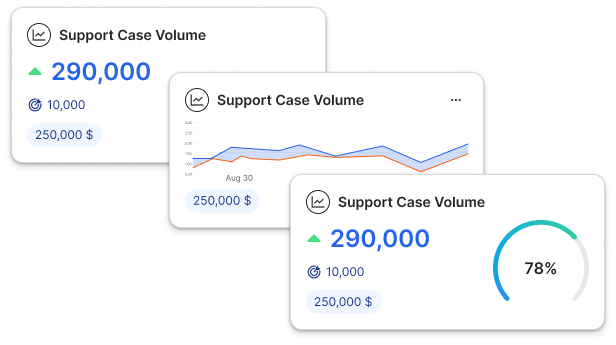
The data card design balances aesthetic appeal with clear data visualization charts. The metric form screen works for both advanced users who need full control and beginners who just need to enter a number and move on.
The biggest lesson from this project: designing for two user types doesn't mean building two features. It means designing one experience with a clear default state that doesn't hide its depth — so every user finds exactly what they need at exactly the right moment.